IoT Data Solves Top 3 Space Utilization Objectives for Business Leaders
The right mix of data is especially important to understand occupant behavior, informing actions that adapt space for occupant and business needs.
Since 2020, economic uncertainty continues to obscure the outlook of corporate real estate. Buildings are underutilized, campuses need to be safer, sustainability is prioritized, and businesses are looking for ways to become future proof. Understanding space has become the top priority for business leaders. According to a recent Verdantix survey, the leading IoT use case by business leaders is space utilization monitoring. And 75% of firms are currently using the technology to optimize space usage.
For many organizations, a modernized data and technology strategy is the best approach for managing priorities and potential real estate risk. The right mix of data is especially important to understand occupant behavior, informing actions that adapt space for occupant and business needs. From our experience servicing over 1,000 global customers, it comes down to three ways to best leverage IoT data:
- Use IoT data to right-size space for optimal business outcomes
- Dig deep into IoT data for insights on how space is being used
- Leverage expertise and useful visualization tools to sharpen insights from IoT data
1. IoT data to right-size space
The top strategy drivers of business leaders are cost reduction, safety and well-being of occupants, and decarbonization. Unsurprisingly, due to remote work and school options, organizations feel they can meet these objectives with less space. Right-sizing is a common goal but reducing a real estate footprint comes with risk; you may have a hard time attracting talent, and individuals may not have the amenities they need to do productive work. Additionally, with variable contract durations, it’s suddenly harder than ever to plan 3-5 years in advance.
By consistently gathering and examining IoT utilization data, space managers can see which spaces are being used, what traffic patterns exists across floors and which areas are most attractive to occupants. Armed with this information, space consolidation becomes a discipline based on real data – not conjecture.
2. Dig deep into IoT data for behavioral insights
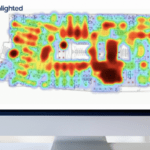
Visualizations such as utilization heat maps or detailed floor-level utilization analyses can show occupancy and utilization data by department, day, and event, as well as by amenity or space type. Such insights can inform and confirm a more efficient use of space. The following are some common ways our customers rely on IoT building data to understand occupant behaviors:
- Understand if conference rooms are used for meetings or by individuals as offices
- Test usage of new spaces and configurations such as creating quiet zones for deep work
- Understand day of week and time of day utilization – potentially offering incentives to “smooth the curve”
- Validate requests for additional space requirements by a particular department
- See if traffic patterns across floors cause work disruptions that require rerouting
- Discover preferences for furniture types or configurations that seem to attract most use
- Determine which areas require cleaning based on use and occupancy
- Understand departmental differences in space use – to plan for restacking if required
While these suggestions are more reactive using historical data, organizations can also make proactive decisions with existing data sources. These use cases can include creating email notifications to alert teams of capacity limits, providing proactive views into crowded areas, such as cafeterias, or even alerting security of unauthorized movement during emergency situations. From these alerting mechanisms, actions can be taken to reroute traffic, offer incentives for occupants to visit on certain days or point to areas of the building for security to check when needed.
3. Expertise and visualization tools together drive better data-driven decisions
Organizations we work with gather occupancy insights from many sources: Enlighted sensor data people count, survey data, desk reservation data, badge data, Wi-Fi data, and much more. This data all provides value in understanding occupant behavior, but we often hear that “too much data is overwhelming” and “we gather a lot of data but we’re not using it.” We suspect these concerns are perpetuated by technology vendors for building intelligence who suggest they can combine data sources into a single, comprehensive view of building performance. The truth is, data-driven projects of this scale require many resources to aggregate and analyze the data. And tools can be very unfriendly for business users who need to create executive reports. Identifying a technology partner that has many options to support you – regardless of your stage of analytic sophistication – will be the most helpful in quickly progressing you from data to insights to decisions. This support can look like offerings for dashboards, BI templates, API access, and custom analytics services.
There is a lot of complexity when it comes to building occupancy data, but it doesn’t have to be difficult to consume. With the right occupancy data strategy, visualization tools and expert support, you can future proof your buildings to easily address shifting space needs and adapt as the corporate real estate landscape shifts.
Did we miss an objective or problem you face? Share it with us here, and let us help you create your occupancy data strategy today.