
Space and Tableau Integration
Understanding corporate real estate trends can be complicated
71% of companies measure office utilization in multiple ways, according to the 2022-2023 CBRE Global Workplace and Occupancy Insights report. Most organizations depend on multiple systems, such as badging, lighting control, space utilization applications, etc., to supply the data necessary for managing their real estate portfolio. One of the main challenges for Enlighted customers today is getting a holistic view and overall understanding of the occupancy and utilization of spaces within their real estate portfolio from the systems they use today. Their goal is to make decisions that will reduce costs and improve occupant experience, but they want an effortless way to get this information.
An intelligent way to access CRE occupancy and utilization insights
To solve this use case, Enlighted offers options for customers to access the aggregated occupancy and utilization data in the most convenient way for them based on their analytical sophistication. The Enlighted Space application provides the fastest path to insights with aggregated occupancy and utilization data in the form of rich reports and visualization features such as heatmaps, motion trails, utilization maps, and time series charts. From working with hundreds of companies, we understand that teams with advanced analytics resources want to easily load the raw data into BI tools such as Tableau, a widely used solution, to combine the data across systems and do their own data analysis. Using this Tableau connection is simpler than you think with our Tableau Web Connector.
How it works
Enlighted exposes the facilities data from the Space application in Tableau via a Web Connector, which is a tool to make data connection within Tableau as easy as possible for business users. This is available to all of Enlighted’s existing and new Space application customers along with the purchase of the Space application license. Customers also need a Tableau license on their end. Enlighted provides an easy to integrate web connector URL which customers can use to load their facilities data into Tableau. The facilities data that are accessible in Tableau helps organizations understand occupancy and utilization trends by portfolio, building, floor or space type. They include tenant, campus, building, address, floor, space name, space category, space department, date, start time, end time, average utilization of an area aggregated over 15 minutes displayed in percentages, minutes occupied, minutes data, and aggregate interval which is 15 minutes.
See it in action
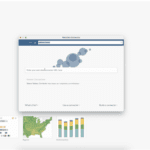
Below is an example of how the data looks when pulled into Tableau.
Tableau Connector Demo
Customers can pull data from other sources into Tableau and blend with the Enlighted data to analyze and perform computations that will aid in complex real-estate decision making. With this connection, customers can create visualizations and reports that are easy to understand and can be circulated among key real estate decision makers thereby aiding efficient, accurate, and data-driven decision making.